Efficiency of the Supre Drive
Last updated: February 16, 2025
Summary
- Compared to conventional derailleur drivetrains with no idler pulley (non-high-pivot), the Supre Drive was measured to be less efficient by approximately 0.9%. To put this in perspective, 0.9% is less than the difference in efficiency between the high and low gears of these drivetrains.
- The Supre Drive is more efficient than other drivetrains with an idler pulley. In other words, it’s more efficient than other high pivot bike drivetrains.
High pivot bikes are fun and fast. The commonly-stated drawback is increased drivetrain drag, but just how much drag is there? And does it vary between the Supre Drive and other high pivot bike drivetrains? To answer these questions, we carried out drivetrain efficiency measurements.
What is efficiency?
When you pedal, you output a certain amount of energy per second, which is measured in watts. A typical power output of a cyclist is around 200 watts. At constant speed on flat ground, all of that power is lost to drag. Part of that drag is from friction in the air passing over you, while another part is from friction between your tires and the ground. A small part of that drag is from friction in your drivetrain.
A useful way to quantify drivetrain drag is percent efficiency. If 5% of your power output was lost to friction in your drivetrain, your drivetrain would have an efficiency of 95%. Drivetrain efficiency is the ratio of power exiting your drivetrain at the hub to the power entering your drivetrain at the crank. We can determine drivetrain efficiency by measuring both the power entering a drivetrain and the power exiting a drivetrain.
Efficiency testing
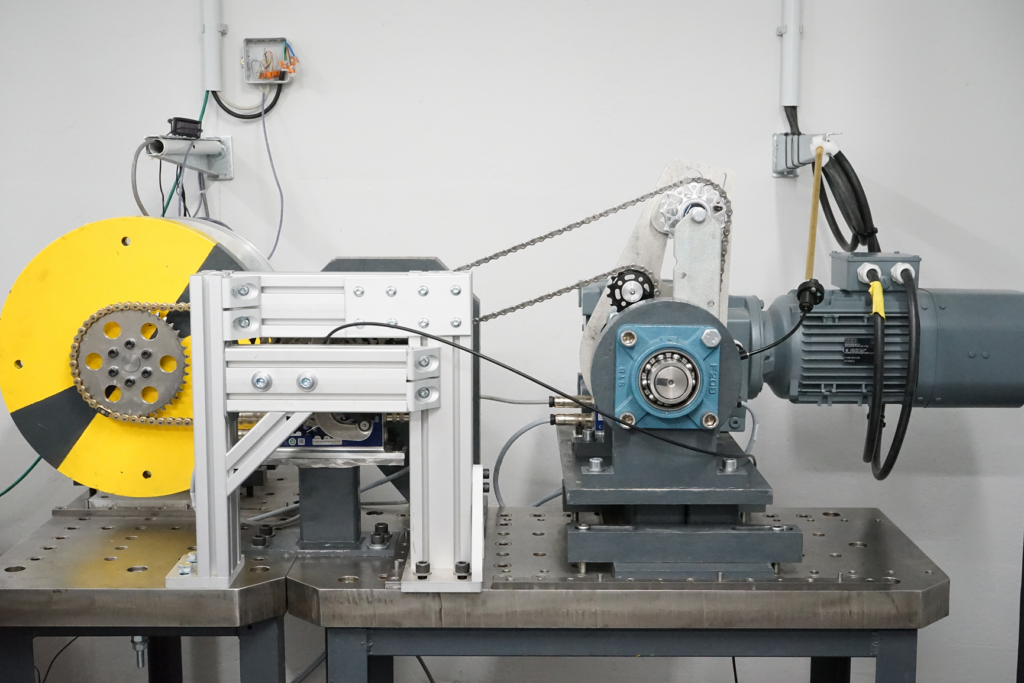
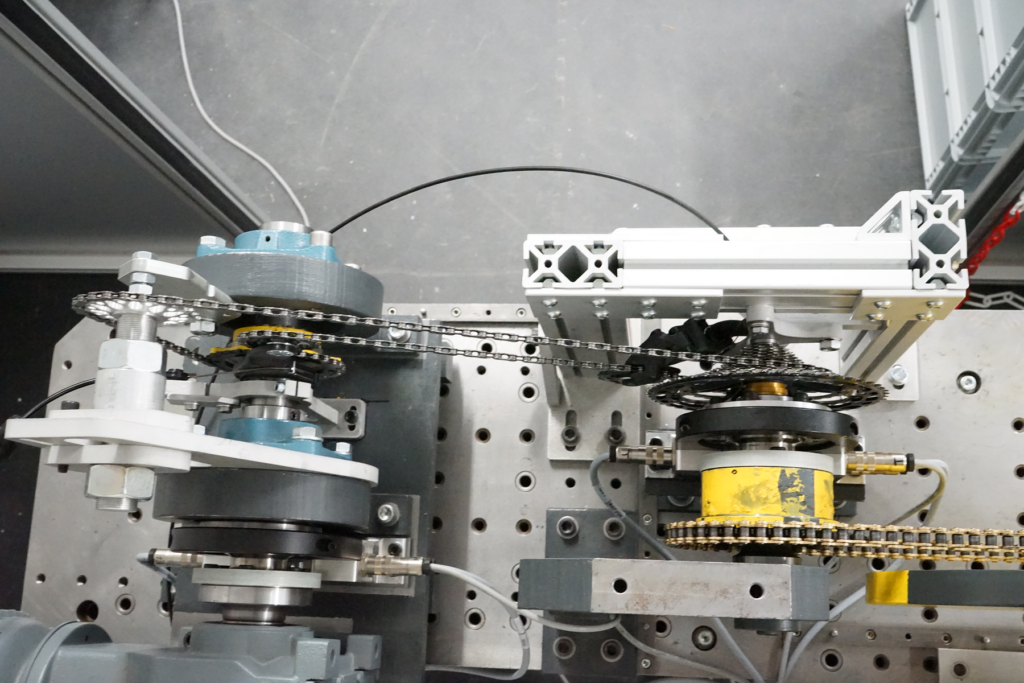
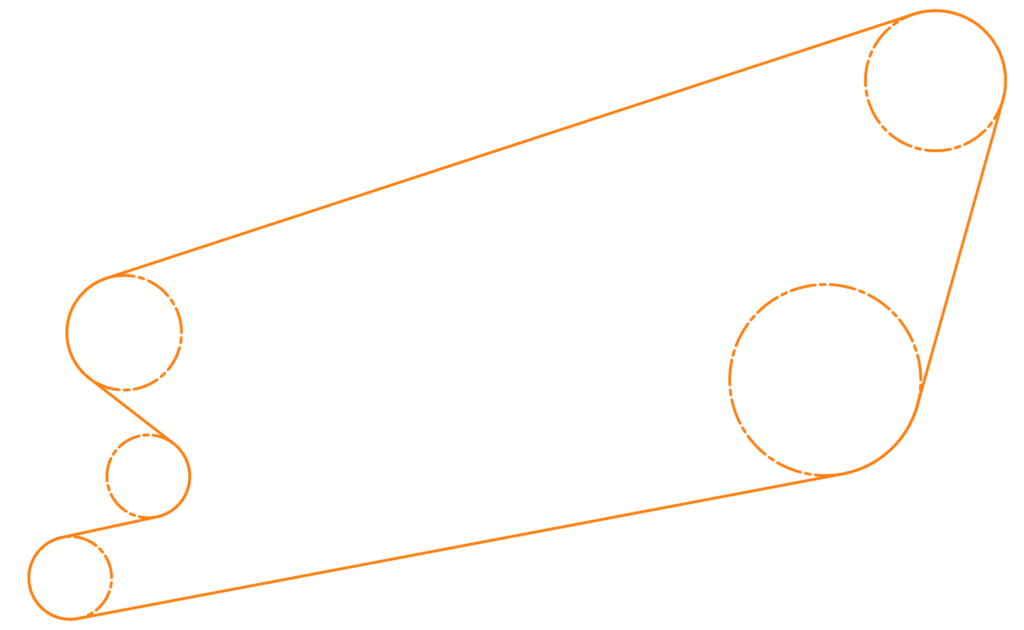
We got an opportunity to use a drivetrain efficiency test rig in Germany at a company called UT, which is owned by Kalle Nicolai (UT is the European distributor of Gates belts for bikes). The drivetrain efficiency test rig has precise power sensors. The following photos are of the test rig, in this case with the Supre Drive.
We measured efficiency for three types of drivetrains:
1. conventional derailleur drivetrain with no idler pulley
2. Supre Drive
3. conventional derailleur drivetrain with the 22t idler pulley of the Supre Drive
Here are efficiency measurement results:
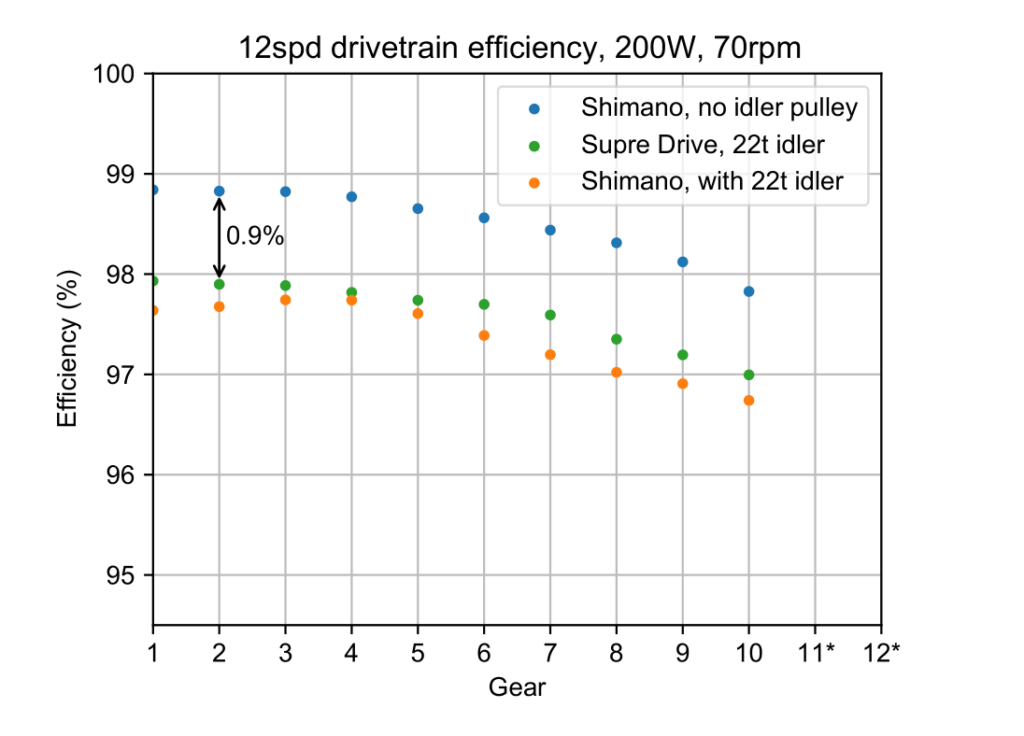
*The reason why data is lacking for the 11th and 12th gears is because a speed limit of the test rig was exceeded. This can be resolved but we didn’t have time to carry out the fix during our time in Germany.
The vertical axis is efficiency. We’re zoomed in here on the 95-100% range. Gearbox drivetrains might not even show up this high on the scale.
All three of these drivetrains have a 12-speed Shimano cassette and chain. One of the first things that we see in this graph is that for all three drivetrains, efficiency is lower in the higher gears. This is because of the variation in cassette sprocket size (bigger sprockets are more efficient).
The blue dots are for a drivetrain with a Shimano XTR derailleur and no idler pulley, and the green dots are for the 12-speed Supre Drive. The average difference is 0.9%. To put this in perspective, 0.9% is less than the difference in efficiency between the high and low gears of these drivetrains.
We also measured efficiency for a drivetrain that doesn’t exist on any bike, which is with a Shimano derailleur and an idler pulley of the same size and at the same position as on the Supre Drive. The efficiency of this drivetrain is slightly less than the efficiency of the Supre Drive. From this result, we can extrapolate that on non-Supre high pivot bikes, the efficiency is even worse. There are several reasons for this. First, on non-Supre high pivot bikes, the idler pulley is usually smaller (18 teeth for the Norco Range and 16 teeth for the Forbidden bikes, versus 22 teeth for the Supre Drive). Small idler pulleys cause more drag. Second, the idler pulley on these non-Supre high pivot bikes isn’t as far forward as the idler pulley of the 12-speed Supre Drive. This means that they have more cross-chaining angle and therefore more drag in high and low gears. Third, some high pivot bikes have a lower chain guider roller which adds even more drag. The takeaway is that the Supre Drive is more efficient than other high pivot drivetrains.
A common remark from people who try bikes with the Supre Drive is that the drivetrain is smooth and quiet. This is consistent with our measurements. In summary, the Supre Drive not only has ground clearance, a reliable derailleur, and reduced unsprung mass, but it also has good efficiency.
To Kalle and others at UT and Nicolai, thank you for your help and for letting us use your drivetrain efficiency test equipment.
Pinkbike covered these efficiency results in an article by Seb Stott.
Additional considerations
High pivot bikes get less caught up on bumps not only on downhills but also on uphills. On chunky pedal trails, high pivot bikes can regain at least some of the efficiency that they lose with the idler pulley due to the effect of not getting pulled backward at each bump. In a review of the Forbidden Druid, Matt Beer noted that “The Druid is a solid choice for a singletrack lover because you can simply stay seated and don’t lose as much speed when pedalling across webs of roots.”
The elevated position of the chain on the Supre Drive means that it gets less contaminated (notice chains sometimes hitting the ground in huck to flat videos). A chain that’s less contaminated will tend to be more efficient. The efficiency results shown here are for clean drivetrains, so they don’t capture the effect of contamination (ideally, efficiency would also be measured with controlled contamination).
What makes the Supre Drive efficient?
The Supre Drive has several design features that improve its efficiency.
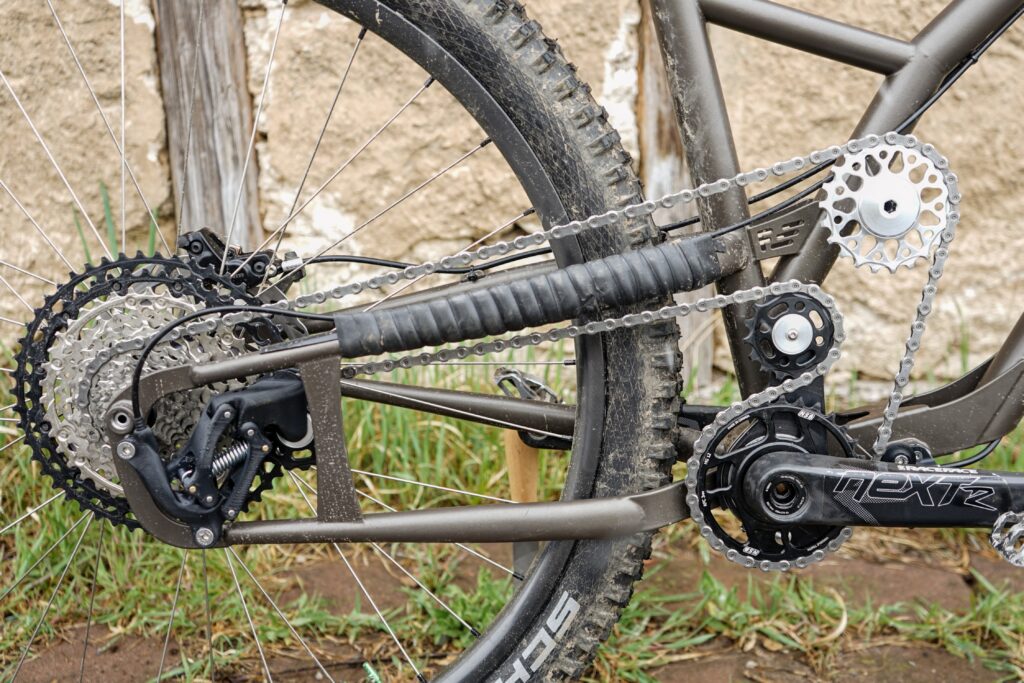
- The pulleys are big. The lower pulleys are bigger than the pulleys on conventional derailleurs. Also, the idler pulley is big. On bikes, the upper portion of chain is under high tension during pedalling, so the size of the idler pulley is especially important.
- The chain tensioner of the Supre Drive produces approximately constant chain tension in all gears, whereas conventional derailleurs produce a lot more chain tension in the low gears.
- The idler pulley is farther forward than the chainring, and this reduces cross chaining angles in high and low gears. Cross chaining is a source of drag.
In summary, the big pulleys, clever chain tensioner, and reduced cross chaining angles all improve efficiency of the Supre Drive.
Details for the nerds
This section includes details about the test method and equipment.
The efficiency test rig has an input motor, a brake, and torque and speed sensing at the input and the output. The motor is a synchronous AC motor. The brake is powder magnetic brake, through which output power was controlled. Torque and speed was measured with HBM T40B sensors.
The input torque and speed sensor is inline with a shaft coming out of the motor. The output torque and speed sensor is inline with the cassette. The assembly with the cassette is connected to the brake by an additional chain. This chain isn’t part of the drivetrain system for which efficiency is measured. The efficiency measurements include the drag from freehub body bearings (Hope Pro 2 Evo) and two large bearings that supported the input shaft. The seals and grease were removed from these two large bearings so that they cause very low power loss.
For all measurements, the input speed was 70rpm. Also, during each measurement, output power was constant. In reality, the power from riders’ legs fluctuates throughout each pedal stroke. The magnitude of error from this approximation is unknown. Ideally, the motor would reproduce the fluctuating power of riders’ legs.
The efficiency test rig was originally designed for single speed drivetrains. As previously stated, an additional chain connected the output end of the drivetrain to the brake. The gearing for this second chain is one to one. It was discovered during the measurements reported here this gearing caused resonances in the drivetrain and in the measured power. These resonances increased in the higher gears and made it impossible to measure efficiency in the 11th and 12th gears. The gearing of the second chain will be changed for future measurements so that efficiency can be measured in all gears.
A set of measurements consisted of a measurement for each gear, all at one power level and speed. For each set of measurements, the chain was lubricated with wet lube. The lubrication procedure consisted of applying lube, actuating the chain, thoroughly wiping the excess lube from the chain, and then repeating these steps two more times.
For each set of test parameters, the drivetrain was cycled for 90 seconds without data recording, to let things stabilize, and then data was recorded for 60 seconds at a sample frequency of 600 Hz. Each point in the graph above is an average of 36,000 data points.
All measurements were done with a Shimano XT 12-speed chain (CN-M8100), a Shimano SLX 12-speed cassette (CS-M7100-12), and a NS Billet 30-tooth HG12 104 BCD chainring.
The chainline is 52mm at the chainring and Super Boost at the rear. This is the configuration for the 12-speed Supre Drive, and the same was used when testing the other types of drivetrains to make the comparison fair.
The damper of the chain tensioners was disabled for these measurements. (The clutch in conventional derailleurs is a type of damper. For the Supre Drive, the damper cannot be described as a clutch because it’s hydraulic.) Dampers can temporarily cause an increase in drivetrain drag after downshifts. This is because of a buildup of static friction that causes an increase in chain tension in the lower portion of the chain. This static friction goes away in normal riding conditions because of small bumps that actuate the tensioner arm. However, in the efficiency test rigs, the static friction could hold for a long time and interfere with efficiency measurements. Therefore the damper of the chain tensioners was disabled. Also, except for the first gear, the measurement for each gear was preceded by an upshift to further prevent interference from the damper.
There is a possibility of systematic error (or bias error). However, any systematic error is likely to be shared between the efficiency measurements for the three different types of drivetrains. Therefore, the conclusions drawn from these results comparing the three different types of drivetrains are more reliable than any comparison with data acquired with other drivetrain efficiency test equipment or with other methods. Caution is warranted when comparing the absolute efficiency results (e.g. 98%) reported here with those sourced elsewhere.